Bryan Gee, Ph.D.
  • Home
  • About me
  • Research
  • Publications
  • Blog
  • Fieldwork
    • Wildlife photos
  • Contact

Temno Talk: a blog about all things temnospondyl

New publication:  Histological skeletochronology indicates developmental plasticity in the early Permian stem lissamphibian Doleserpeton annectens (Gee, Haridy & Reisz; Ecology & Evolution)

2/7/2020

2 Comments

 
Title: Histological skeletochronology indicates developmental plasticity in the early Permian stem lissamphibian Doleserpeton annectens
​Authors: B.M. Gee, Y. Haridy, R.R. Reisz
Journal: Ecology & Evolution
DOI to paper: 10.1002/ece3.6054
General summary: ​​Doleserpeton is an early Permian amphibamiform from Richards Spur that has long been of great interest in hypotheses of the origin of modern amphibians. It's also reported as one of the most abundant taxa from Richards Spur - the scientist who described it, the late John Bolt, termed certain deposits from the caves as "D-concentrate" to refer to the extreme density of Doleserpeton material (largely limbs). Because of its hypothesized close relationships to lissamphibians and the sheer abundance of material, there's a natural import for doing histological work on Doleserpeton. 

So in this study, we cut an absurd number of limb bones (60 right femora) and then looked at growth patterns (or lack thereof) to figure out how a putative stem lissamphibian grew. We found absolutely no pattern other than femur size scaled positively with inferred age (phew!) - there is a huge spread of data points, which can be attributed to several (not mutually exclusive) causes. We also utilized this large sample size to run some sensitivity analyses i.e. what could happen with more traditionally low sample sizes? When you sample in the 10 or 20 bracket, you can get some wild results, like negative scaling ​between femur size and inferred age and near perfect fits to simple linear regressions (growth is rarely linear). This is really just visualizing the obvious truism that more data improves representation and robusticity of interpretations, and low sample size...well be careful with low sample size.
Picture
#AcademicAlbum cover for this paper, something new that Yara and I are trying out for our scicomm (this riffs off The Life of Pablo album by Kanye West if you're confused).
Picture
Thin section through the mid-shaft of a femur of Doleserpeton annectens. Colours are a result of the oil enrichment of the fossils when transmitted light is passed through them.
Picture
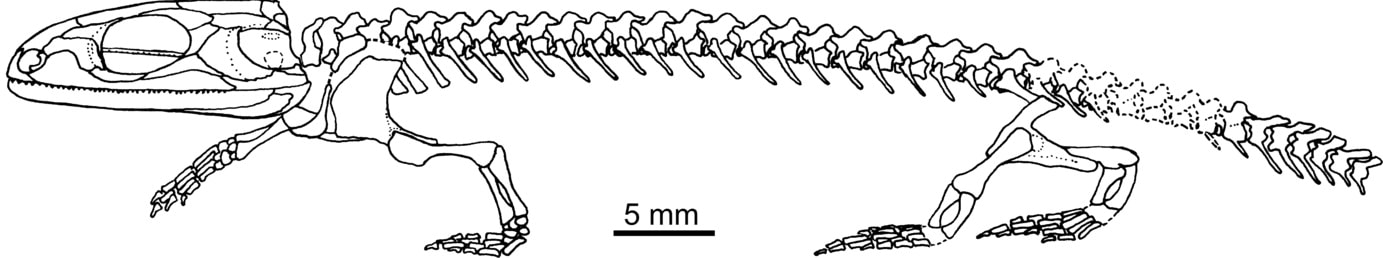
Skeletal reconstruction of Doleserpeton by Sigurdsen & Bolt (2010).
Picture
Amphibamiform relationships from a recent phylogenetic analysis of dissorophoids by Schoch (2019).
Doleserpeton fast facts
  • Named in 1969 by the late American paleontologist John Bolt (Field Museum, Chicago)
  • Name derives from the Dolese Brothers Limestone Quarry, the commercial operation that quarries the limestone and inadvertently the fossils, and -erpeton, a common root for early tetrapods meaning "creeping thing"
    • Only known from Richards Spur - closest relative is the Carboniferous-age Amphibamus from Mazon Creek, Illinois
  • Most completely known terrestrial Permian amphibamiform - almost entire skeleton known, though not much articulated material
  • Possesses numerous features thought to be lissamphibian synapomorphies, like pedicellate, bicuspid teeth
Picture
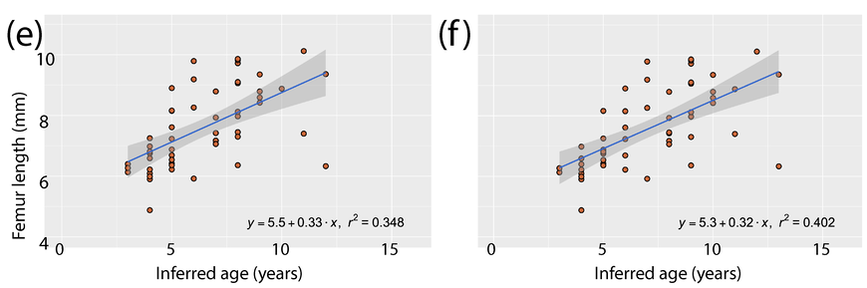
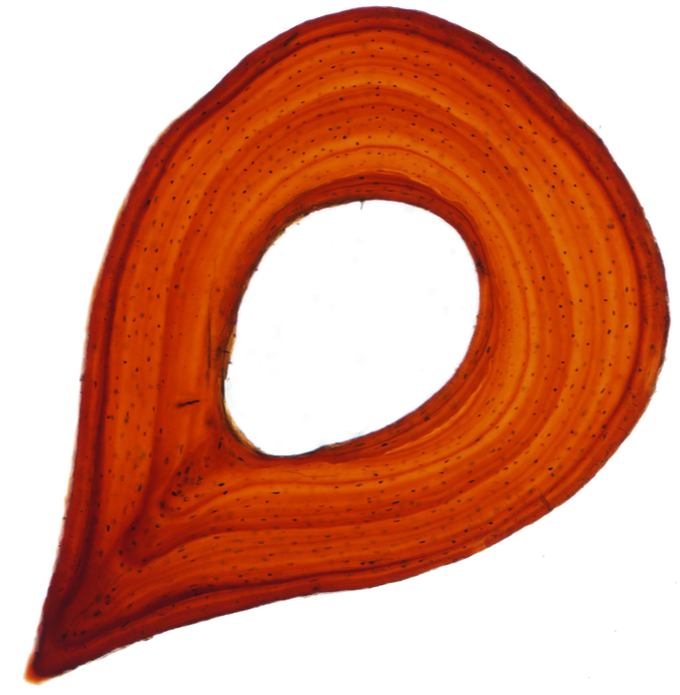
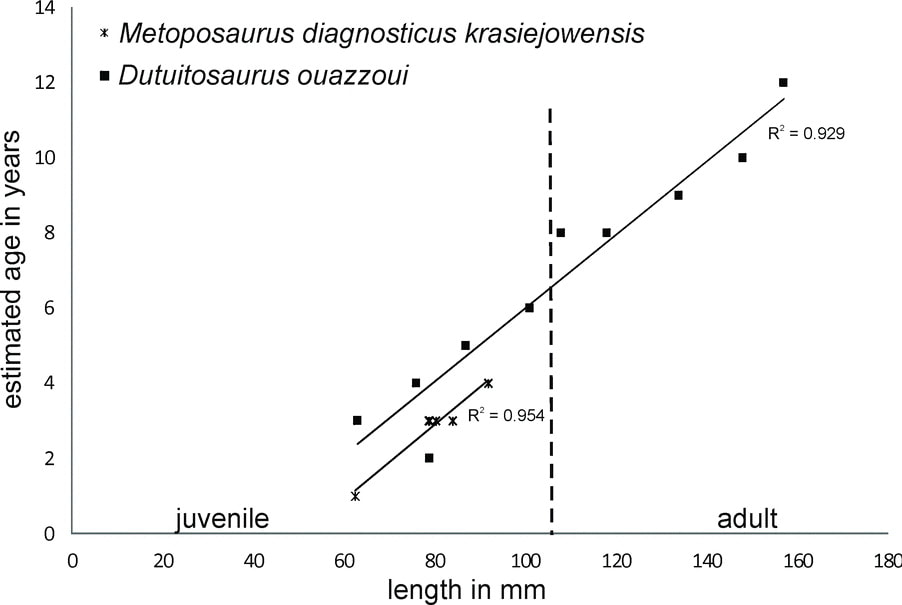
Here's the most detailed illustrations ever published of a Doleserpeton femur. They were done by a former ROP/BIO481 student in our lab in 2017, Paige Urban, who is now a vet student at Guelph! We used this and previous publications as a reference for identifying limb bones of Doleserpeton to sample; they can be pretty well identified by their slenderness and the prominent trochanter; similarly sized limbs of dissorophoids that reached much larger adult body sizes wouldn't be this well-ossified at a size that would probably be within the first few months of life, whereas this sized limb in Doleserpeton could belong to an individual more than 10 years old.
Picture
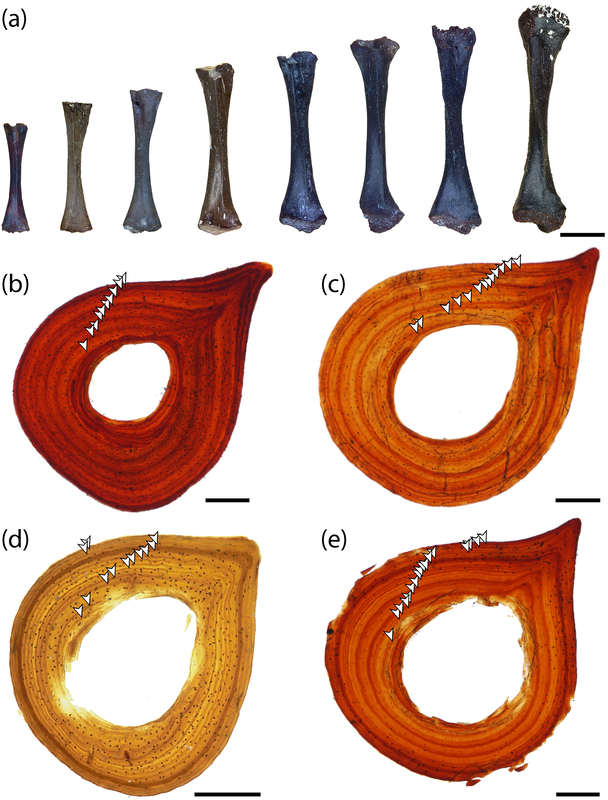
Representative range of sampled specimens and thin section with lines of arrested growth (LAGs) marked by arrows.
The methods
Pretty standard histology methods - embed specimens, cut them, glue them to slides, grind them down to be imaged under a microscope. Read the paper if you want the nitty-gritty on equipment, etc. I will just point out that these are really small - the scale bar in Part A is 2 mm, and the scale bar for Parts B-E is 0.25 mm. Then we went through and counted lines of arrested growth (LAGs), which are marked by distinctive bands extending around the circumference of the bone. The arrows in the above thin sections mark those lines that we counted. The difficult part came when we were making interpretations of the LAGs - does each one represent a year of growth, or is it a different periodicity. Based on the clumping of LAGs in pairs of closely spaced lines, with more space from the adjacent pair than between the pair, we interpreted that a lot of these have what are called "double LAGs," or where a pair represents two periods of the year in which growth was unfavourable. Part C above has some particularly clear double LAGs. We then plotted the inferred age based on LAG count (x-axis) against femur length (y-axis) to see if our inferred age was tightly correlated with femur size (the proxy for overall body size), which you can see below.

Raw data

Adjusted data

Picture
We had to "adjust" some of the data because there was clear evidence that remodelling had occurred in some individuals, which removes the innermost (oldest) depositions of bone and thus the record of LAGs. There are a number of methods for what's called "retrocalculation," where you attempt to infer how many LAGs have been lost, but they are complicated for small specimens where even a very slight (< 1 mm) difference in plane of section can essentially invalidate these methods, which rely on things like overlaying and measuring diameters. So we used a crude "adjustment" where we added +1 inferred year for any specimen in which there was clear remodelling under the assumption that at least one year of growth had been lost; this certainly underestimates some samples, but because we are testing the relationship between size and age, we didn't want to add more missing years to larger specimens because that would bias the data. 

Raw data

Adjusted data

Picture
Growth "curves"
A growth curve is exactly what it sounds like, and it's definitely supposed to curve. That being said, your data do not always fit to a curve, and they may actually fit to some other fitting model like a straight line or a parabola that don't make much biological sense. Especially with fossils, there can be a lot of reasons for this - some examples can be that you are only sampling part of a growth curve and so you get a section modeled better by another regression or that there are confounding variables that aren't accounted for (e.g., size differences between sexes). The huge spread in our data made this more complicated. Above are some simple model fits using different types of linear models (2nd-order polynomial [parabola], simple linear, exponential, and logarithmic. Why'd we use really simple models? For one, we don't have a lot of other variables to use. In living animals, you can add in body mass, but you can't weigh a dead animal known only from one limb bone, and estimating it is usually done by one of the already existing variables - body size. We also can't control for things like biological sex or contemporaneity (did they live at the same time). So the model almost certainly underfit the data. Apparently the data fit is actually not that bad. For one, it goes in a logical direction (higher body size with increased age), and what we call the r-squared (R^2) value, or the correlation coefficient, is not that bad. It's important to note though that a high correlation does not equate to a high biological accuracy. We could get a perfect fit with a...51-order polynomial (x^51) because that would create a parameter for every single data point we could include. Statistical significance =/= biological significance. 

Raw data

Adjusted data

Picture
Picture
Linear regressions of femur length vs. estimated age in two species of Late Triassic metoposaurids (figure from Konietzko-Meier & Sander, 2013). Note the very high R^2 values.
The correlation coefficient tells you how much of the y-axis variable (dependent) is predicted by the x-axis variable (independent). So a value of 1.0 means that the X predicts 100% of the variability of the Y. Apparently our values over 0.3 here are actually pretty good! I was comparing to previous temno studies that had r-squared values over 0.9 (see left), so I thought ours were really bad, but basically somebody from every other biological discipline told me they were jealous. But anyway, this clearly underfit model indicates that inferred age is not a great predictor of femur length. Another way of thinking about this is that an individual of a given age X can be within a wide range of body sizes. 
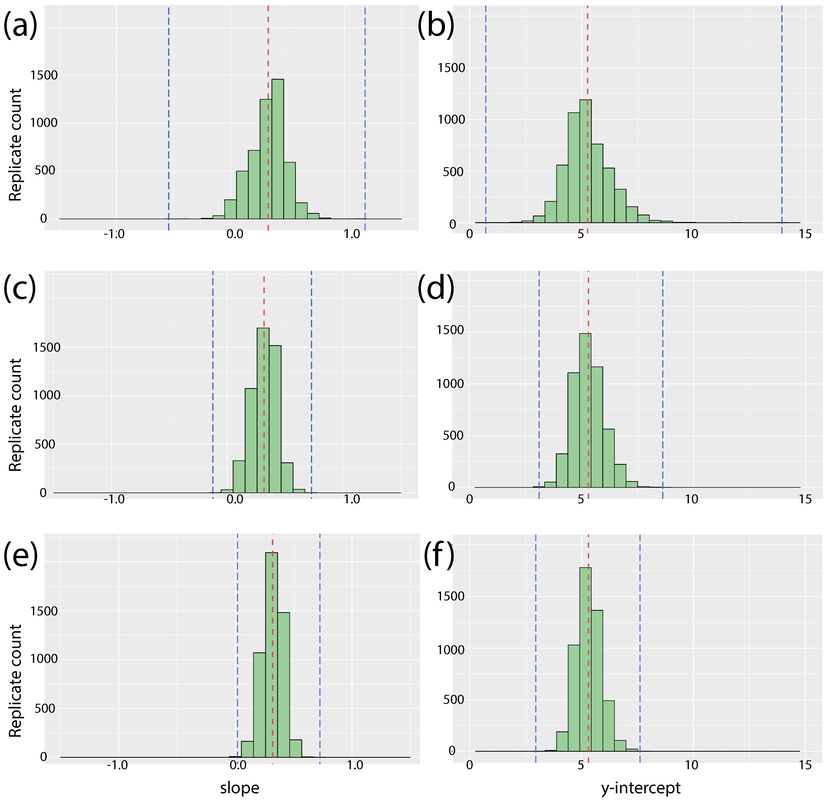
Sample size
Sample size is everything in science. If you only have one observation, how much can you really say about a question or a phenomenon? Well, really you can say anything you want (and we often do in paleontology), but how robust or well-supported what you say is more up for debate. What we did here is a series of sensitivity analyses to look at how small sample sizes affect the observed correlation between body size and inferred age. Of the 52 samples that we got LAG counts for, we subsampled in size bins of 10, 20, and 30 (essentially jackknifing the data) where a code would randomly grab X number of data points, plot them, and calculate the regression for those select points (we just used a simple linear model because the model choice wasn't super important for this particular part of the study). When you code this in R, you can run a for loop to do this for however many iterations you want to do it quickly (we did 5,000). We then pulled each variable (y-intercept, slope, correlation coefficient) from each iteration and then produced a histogram of each variable. You can see these below; from left - correlation coefficient (r-squared); slope; y-intercept. 
Picture
Picture
What we found is that the extremes are way more likely in low sample sizes (look at the spread for the size bin of 10 for correlation coefficient on the left). Now this isn't surprising or novel on its own; low sample size is more susceptible to confounding variables that aren't being modeled. However, our analysis demonstrates just how wild it can get. The mean (average) value changes little with sample size, but the range of possible outcomes changes massively (marked by dashed blue lines). For n = 10, it was possible to get:
  • Negative slope = decreasing body size with increasing age
  • Zero slope = no change in body size with increasing age
  • Correlation coefficient > 0.95 = very strong relationship between inferred age and femur size
  • Initial femur size > 10.5 mm = larger than any specimen we actually sampled in our analysis
Now two of these are biologically implausible - very few things get smaller as they get older, and very few things have zero change in size as they get older. The other is not biologically implausible per say, but it suggests a very constrained pattern of development; there are essentially no factors that strongly influence body size other than age. In other words, you could predict very accurately (if this were true) what size any given animal would be at any given age. Most tetrapods do not have super constrained development though.

What's it all mean? (the biology side)

What's it all mean? (the methods side)

  1. Based on the spread of our data, we're interpreting it as evidence of developmental plasticity, which is a common strategy among living amphibians and which allows them to modulate their development based on often unpredictable environmental factors, such as water availability (especially ones that lay their eggs in seasonal ponds). In other words, development was not tightly constrained.
  2. Double LAGs indicate that the season was particularly rough on the amphibians twice each year, probably during the summer and the winter as they are now. This would produce aestivation (summer) and hibernation (winter) and thus two LAGs per year. Although we often think of the more extreme temperatures as the hallmarks of those periods, other environmental factors like water availability or activity of other animals (probably the prey items) could also exert an influence on which season Doleserpeton ​was active in. 
  1. Be careful about high correlations in small samples - sampling across a very broad size range is important, but so is sampling similarly sized specimens, which is the most direct way to tell whether age correlates strongly with size.
  2. Histo sampling from multi-taxic bonebeds can be fraught with peril. Okay, maybe not peril, but it can be complicated by a lot of things. In this case, one of the concerns was that we have two other amphibamiforms from Richards Spur, Pasawioops mayi and a species of Tersomius, and neither one has known femora. So we have to rely on skulls for relative abundance and inferred adult size, and skulls aren't always the greatest proxy. We feel that our identifications are pretty solid, and the perceived relative abundance of Doleserpeton is stated to be exceptionally higher than those other two, but only finding and sampling definitive postcrania of the other taxa will prove this for sure.

Refs
  • Bolt JR. 1969. Lissamphibian origins: possible protolissamphibian from the Lower Permian of Oklahoma. Science 166: 888-891. DOI: 10.1126/science.166.3907.888
  • Konietzko-Meier D, Sander PM. 2013. Long bone histology of Metoposaurus diagnosticus (Temnospondyli) from the Late Triassic of Krasiejów (Poland) and its paleobiological implications. Journal of Vertebrate Paleontology 33: 1003-1018. DOI: 10.1080/02724634.2013.765886
  • Schoch RR. 2019. The putative lissamphibian stem-group: phylogeny and evolution of the dissorophoid temnospondyls. Journal of Paleontology 93: 137-156. DOI: 10.1017/jpa.2018.67
  • Sigurdsen T, Bolt JR. 2010. The Lower Permian amphibamid Doleserpeton (Temnospondyli: Dissorophoidea), the interrelationships of amphibamids, and the origin of modern amphibians. Journal of Vertebrate Paleontology ​30: 1360-1377. DOI: 10.1080/02724634.2010.501445
2 Comments
David Marjanović
2/7/2020 01:09:09 pm

A good paper and a good blog post!

Reply
David Marjanović
2/7/2020 01:10:14 pm

Oh, I forgot:

"per say"

per se = Latin for "by itself". Has nothing to do with saying, but French se & soi are descended from Latin se.

Reply


Leave a Reply.

    About the blog

    A blog on all things temnospondyl written by someone who spends too much time thinking about them. Covers all aspects of temnospondyl paleobiology and ongoing research (not just mine).

    Categories

    All
    How Do We Know...?
    New Publications
    Temnospondyl Tuesday

    Archives

    February 2022
    November 2021
    October 2021
    May 2021
    March 2021
    February 2021
    January 2021
    December 2020
    August 2020
    July 2020
    May 2020
    April 2020
    March 2020
    February 2020
    January 2020
    December 2019
    October 2019
    September 2019
    August 2019
    July 2019
    May 2019
    April 2019
    March 2019
    February 2019
    January 2019

    RSS Feed

Powered by Create your own unique website with customizable templates.
  • Home
  • About me
  • Research
  • Publications
  • Blog
  • Fieldwork
    • Wildlife photos
  • Contact