|
Title: Size matters: the effects of ontogenetic disparity on the phylogeny of Trematopidae (Amphibia: Temnospondyli) Authors: B.M. Gee Journal: Zoological Journal of the Linnean Society, no. 170 (Advance Articles) DOI to paper: 10.1093/zoolinnean/zlz170 General summary: Phylogenies represent our inference of the relationships between different organisms, and can be as broad-scale as all living things to as fine scale as species of rhinos. It is of course an inference because in very few instances can be observe or capture speciation in short time intervals, and reconstructing the relationships of long-extinct taxa, especially those without close living relatives, is even more complicated. Phylogenies are therefore very controversial because there are a slew of different ways that one can go about doing one, and different scientists have different preferences. Which taxa are included, which features are analyzed, and how each taxon is "scored" for each feature can vary widely across studies, which unsurprisingly produces very different results and in turn, very different scenarios of evolutionary history (e.g., temporal origin, rates of diversification, geographic origin, relation to modern taxa, etc.). The hot topic in early tetrapod research right now is early amniote phylogeny, particularly with respect to parareptiles, 'microsaurs,' and varanopids. That doesn't mean that there isn't a lot of work to do with temnospondyls though, which of course is what this paper is about!  Photo courtesy of U.S. Forest Service. This paper is not about moose (or "meeses" as some people like to call them), but the above picture will come into play in a bit. There are a lot of challenges for doing phylogenetics, and for paleontologists, one of the main ones is being stuck with morphological (and no molecular) data. One of the outcomes of this is parsing out morphological differences associated with ontogeny (development) from those associated with taxonomy (different species / genera). Here's an example: adult deer and adult moose have antlers; babies of both animals do not. So the first problem that comes into play is whether you can tell that a baby-moose-equivalent in the fossil record is in fact the baby of an adult-moose-equivalent because they look pretty different in some regards (body proportions, presence or absence of antlers [which can also be sexually dimorphic], etc.); remember that you can't just raise an extinct tetrapod and watch what happens. Depending on what morphological features you used, you might actually end up clumping baby moose and baby deer and inferring that they are closely related to each other because cervids of different species but of about the same age often have similar body proportions (look at those really gangly legs!). There are definitely instances in which one species is probably just a juvenile form of an already known species in which there are a lot of morphological changes associated with development. Comparing babies and adults of one species is already an "apples and oranges" kind of situation, but comparing babies of species X and adults of species Y is like "apples and cabbages" (I just made that up) - somewhat unsurprisingly, baby deer look less like adult moose than baby moose look like adult moose. Now again, for living animals, you can just raise a baby deer and a baby moose and figure out (a) who is related to who and (b) what changes occur throughout development. But you can't observe this for extinct taxa, and chances are high that you have a very limited range of development known for any given taxa. Even the absolute size of the animal, which we often use to age a living animal, may not be very informative if there is at least some data to suggest that modern taxa are not a good proxy (temnospondyls are a good one for this). All of these challenges can be a major problem because a lot of phylogenetic characters that are only meant to separate different species are potentially also changing during development within at least some taxa.
There's a lot of nuances that make it complicated, and phylogenetics is already a very technical sort of thing, but my main findings can be summarized as follows:
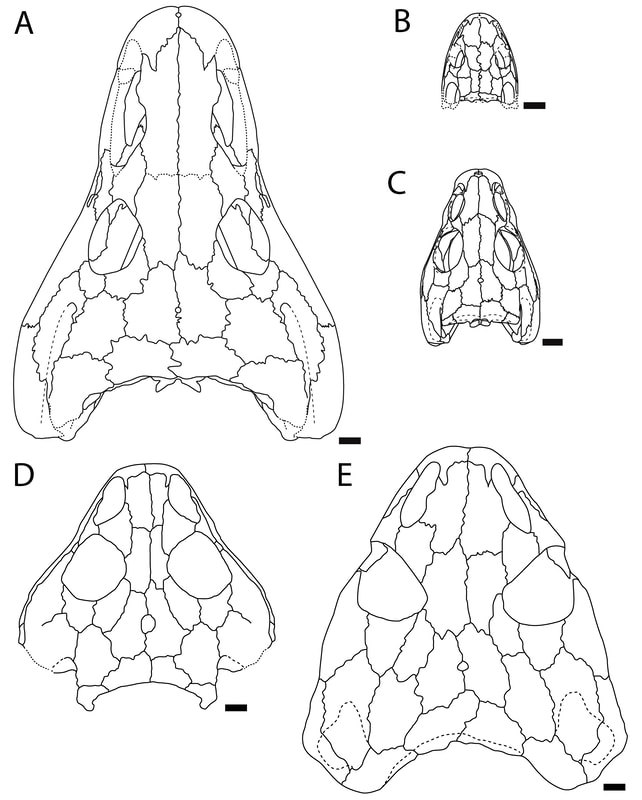
Ontogeny vs. taxonomy If you keep up with my research, you'll notice a longstanding trend of me investigating temnospondyl ontogeny, particularly as it relates to screwing with our taxonomy. This particular project on trematopids was inspired by my other paper on trematopids (Gee, Bevitt, & Reisz, 2019; Front Earth Sci) in which we described an immaculately preserved, relatively small skull of Acheloma from Richards Spur. As I discussed, in rather lengthy fashion, the taxonomic referral was complicated by the fact that the specimen shared a lot of features with both large specimens of Acheloma (already known from RS) and with small specimens of Phonerpeton (only known from Texas). The caveat here is that Phonerpeton is only known from small specimens, while Acheloma has some of the largest trematopid specimens known (compare A and C from the comparative figure above). A good example is the relative length of the orbit and the external nostril. In large Acheloma, the nostril is way longer than the orbit, but this is really the only trematopid in which this occurs. Small Acheloma and all Phonerpeton specimens have a relatively smaller nostril. The relative length of the snout is another feature in which small and large specimens differ; Phonerpeton isn't too far off in proportions from some dissorophids with relatively long skulls, whereas the large Acheloma have a distinctly elongated snout. IF you make the assumption that the largest Phonerpeton specimen is an "adult," of comparable maturity to the much larger, largest specimen of Acheloma, then it's super easy to distinguish them. However, there's a lot of evidence to suggest that Phonerpeton is not a diminutive adult (there are vague whispers of Apacheasaurus in here...). As such, we're at the "apples and cabbages" analogy I made before: juveniles of species X and adults of species Y. A very basic phylogenetics primerPhylogenetics is complicated; people spend their entire lives developing methods and testing them on simulations. Learning phylogenetics can also take a long time. I'm just going to define a few key terms that will help the average non-scientist understand what the heck my results mean!
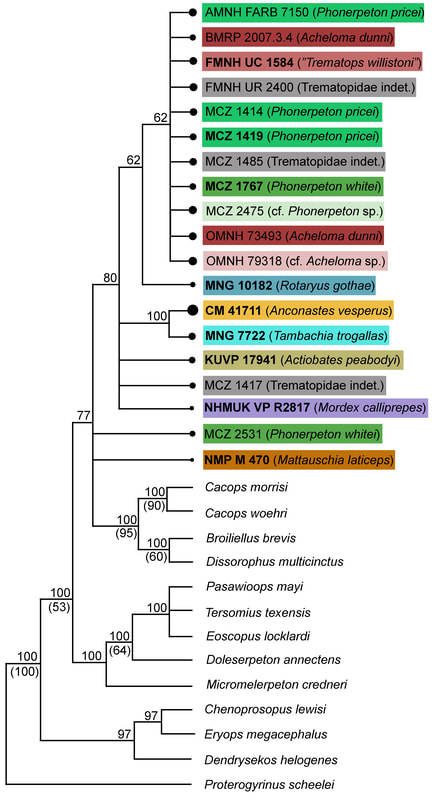
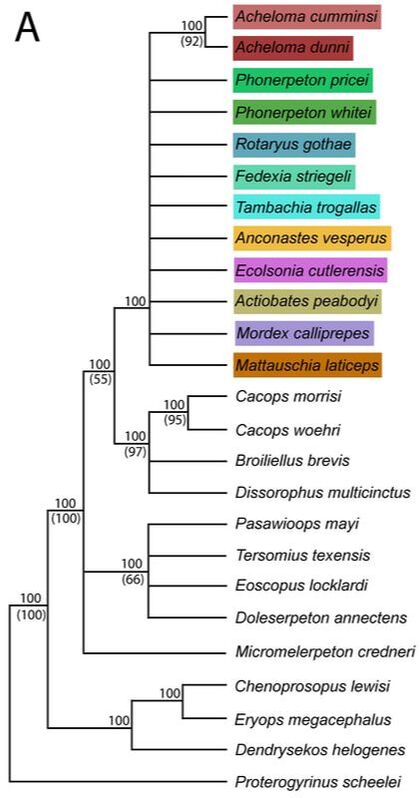
The most common method for paleontologists is called a parsimony analysis. This means that we are looking for the most parsimonious solution, or the simplest explanation, because we believe it is the most likely scenario - you may have heard this as Occam's razor in other disciplines. Now the most parsimonious solution is not always the actual solution; life has a way of sometimes taking very convoluted ways to get places. But assuming that the simpler explanation is more likely than the complex explanation is a longstanding convention that we operate on. In phylogenetics, a parsimony analysis (there are many ways to run one), will find the most parsimonious trees (MPTs). Now if there is more than 1 MPT, and there may be 1000's, then they do not have the same topology, but they do have the same number of steps. Steps are, in the strictest sense, the number of quantitative steps that it takes to produce the topology under the input parameters. The more steps, the more complex the solution. Inherently, a larger dataset usually has MPTs with a greater number of steps. Now there are two caveats here: (1) even if there is only 1 MPT with X number of steps, there may be 1,000,000 MPTs with X+1 number of steps - in other words, nearly as simple solutions (and +1 step for a tree that is, say 2,400 steps, is not very much added complexity); and (2) getting a large number of MPTs is not usually good - it suggests that the analysis cannot resolve in favour of one particular solution. So when we get more than 1 MPT, we compute consensus trees. Consensus trees will combine all of the MPTs together based on a defined numerical threshold for consensus. For example, if the relationship between species A and species B occurs in 75% of the MPTs, it will be recovered in what we call a majority-rule consensus, which sets the threshold for 50% of MPTs or more (50 is entirely arbitrary because we like clean, round numbers), but not in a strict consensus, which sets the threshold at 100% of MPTs, no less. Computing consensus trees can help you to identify areas where there are differences in topologies and if there may be certain taxa causing problems; some relationships are always recovered and others more infrequently. The other method, increasingly popular in paleontology and already established in other disciplines (including outside of biology) are likelihood analyses. These are really complicated to explain and involve a lot of math, but the gist of it is that these methods involve computing probabilities given the available data, specified models of evolution, and "prior" knowledge. Likelihood methods are really good with big datasets and can do millions of iterations in minutes on normal laptops. These methods do not recover MPTs, but they do compute consensus trees. Whereas the percentage of each node in a parsimony analysis represents the percentage of MPTs in which that node occurs (what we term 'frequentist statistics'), the percentage of a node in a likelihood analysis represents the probability of that node given the data, so they are not the same thing. Usually we compute majority-rule consensus trees for likelihood analyses, but there is also something called an all-clades compatible consensus that forces every single node into resolution (albeit with usually very low probabilities). 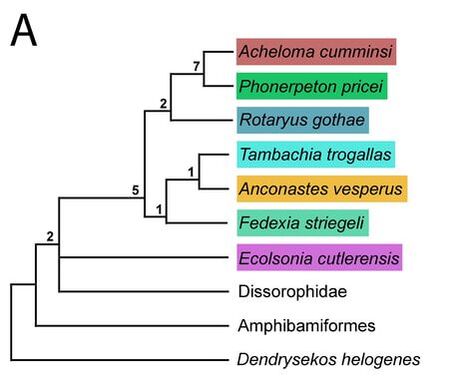 Here's a simple phylogeny that will allow me to explain some of the other basic terms. A sister taxon is the one immediately related to either another taxon or to a group of taxa. So Acheloma cumminsi and Phonerpeton pricei are sister taxa. Rotaryus gothae is the sister taxon to this pair. A polytomy is where you have an unresolved node (more than two taxa). Here, there is a polytomy made of Dissorophidae, Ecolsonia cutlerensis, and a grouping of all other trematopids (the ones in coloured boxes). If you recover more than 1 MPT, the strict consensus will always have a polytomy because that is where the MPTs disagree. However, you can have a lot of polytomies, and this is BAD - it gives you no resolution from which to draw interpretations regarding the evolutionary history of something. In this case, it's unclear whether E. cutlerensis is more closely related to Dissorophidae or to all of the other trematopids. A clade is a group of taxa descended from a common ancestor. So Acheloma cumminsi and Phonerpeton pricei are a clade. If you add Rotaryus gothae, this is a second, larger clade. However, if you add Tambachia trogallas to these three, this is not a clade because T. trogallas is closer to other taxa that are not included in that group. All four of these taxa do share a common ancestor, but that ancestor also gave rise to many more taxa not included in that group (such as Anconastes vesperus). So what did I do? The methods...are also a little complicated for non-scientists. When we do morphological phylogenetics, we make a table that has columns of what we call characters, which are features (e.g., limbs) that have at least two states (e.g., present or absent) and rows of the operational taxonomic units (OTUs) that we are sampling. You can check out a screenshot of part of my matrix below. Usually OTUs are coded at the species level (e.g., Tyrannosaurus rex), although they may be at the genus level or sometimes even higher. OTUs can go lower than the species level though - they can go to the specimen level. That's what I did here. Normally when you code species-level OTUs or higher, you code based on the most mature specimen available, and from this comes a massive assumption that all of the specimens that you are coding are of comparable maturity so that they are at least "apples of X and apples of Y." This is usually not true, but I'll come back to that. When you code specimen-level OTUs, you may have several OTUs for one species, although some may still only be represented by one specimen for any number of reasons. However, more OTUs can offer more resolution. For example, maybe you can differentiate juveniles of species X from adults of species X. This will not resolve the issue of assuming that all of your OTUs are of the same maturity - they very likely are not if you are doing this type of OTU sampling - but it will give you a clearer insight into the effect that ontogenetic disparity is having. In other words, when you only have species-level OTUs, maybe species X, represented only by small, probably juvenile specimens, is not recovered as closely related to species Y, represented by both large and small specimens but only coded for the large "adults." But if you break them down into constituent specimens, now you have to code the small specimens of species Y ("juveniles"), and maybe you notice that all specimens of species X, all small in size, are very similar / closely related to small specimens of species Y. 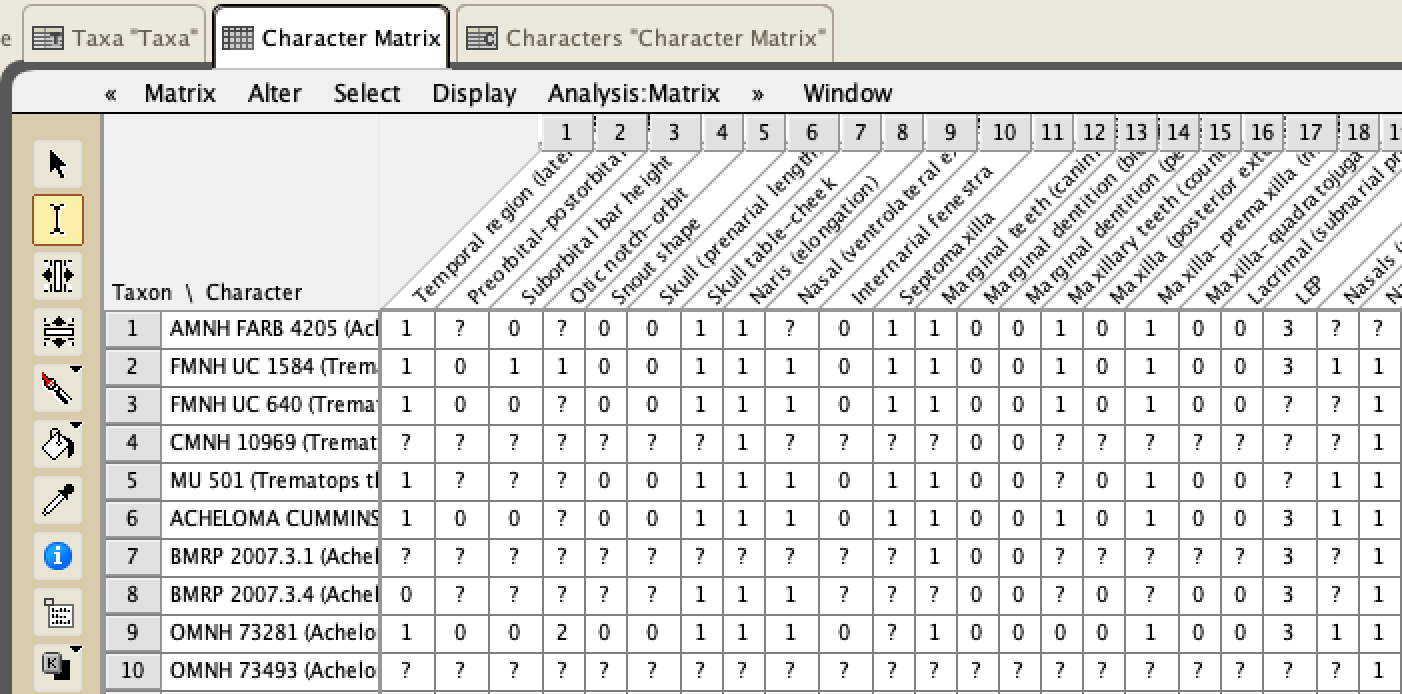 Screenshot of part of my character matrix, with characters (morphological features / attributes) as columns and OTUs as rows. In addition to coding specimen-level OTUs for the trematopids, I also ran a bunch of permutations based on the size of specimens, and I also did an analysis with species-level OTUs to compare to previous studies that only used species-level OTUs but with an incomplete sample of trematopids. In order to understand all of the following diagrams, you will need to know that:
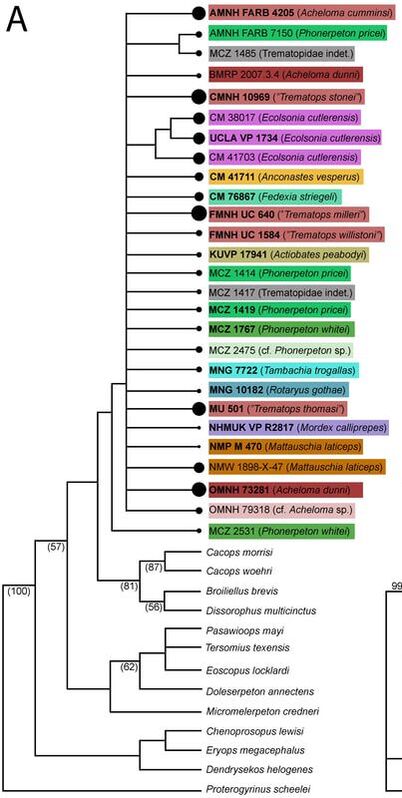
ResultsIf you are still with me, congratulations! Phylogenetics is painfully complex for many people. Take five if you need to. I'll pick up with the direct results below. Note that I'm only discussing the parsimony analysis because the likelihood analysis didn't really differ that much, and it's a little more complicated to understand the theory behind it. This permutation is what I called the taxonomic reduction permutation. If two specimens were scored the same for every character that they both could be scored, but one specimen could be scored for some additional characters for which the second could not, then the second was removed because it was redundant with the more complete one.
In general, there is very little resolution, and it's very hard to say much from this tree about trematopid relationships. However, I want to call your attention to the majority-rule consensus tree. Look at the OTUs of Acheloma (some shade of red, mostly at the top). Notice that there is a distinct size separation between the large ones and the small ones. This suggests that this phylogenetic matrix can capture ontogenetic disparity among specimens - juveniles are recovered in an earlier diverging position because they don't have some aspects of the "adult" morphology. Okay, now let's look at a size-based permutation. Trematopid specimens span a wide range in skull length (<4 cm to about 18 cm). But nearly all of them are either <8 cm or >10 cm; there is only one that I sampled (holotype of Anconastes versperus) that is between 8 and 10, and the specimen is 9.9... So for my size-based permutations, I did one where I took everything below 8 cm in skull length (+Anconastes) and one where I took everything above 10 cm in skull length (+Anconastes). You'll notice that in the one below, there are only small circles - this is the small-bodied specimen permutation. Again, on the LEFT, we have the strict consensus (ignore numbers and little snippet at bottom right), and on the RIGHT, we have the majority-rule consensus (numbers above line = % of MPTs in which a node occurs). Now again, you will notice that both look more like combs than trees. In fact, there is only one trematopid node that is resolved in 100% of MPTs - a sister relationship between Anconastes vesperus and Tambachia trogallas. Funny that this was not recovered in the above permutation. Also what is noteworthy is that in the majority-rule consensus, there is almost no resolution. In the above permutation, most specimens of Acheloma formed a clade, and they largely split based on relative size. Here, there is no Acheloma clade (they form a clade with Phonerpeton), and no size sorting. Well duh, most of the specimens are nearly the same size! So of course it is unlikely that there will be size sorting because these are all comparably mature specimens. Acheloma and Phonerpeton cluster because they have long snouts compared to other trematopids; you can see that Rotaryus gothae is the sister taxon to this pair in a majority of MPTs - this taxon also has a long snout. So essentially what this is showing is that juveniles of one genus (Acheloma) are nearly indistinguishable from juveniles of another genus (Phonerpeton), even though these two genera were more clearly distinguishable in the above permutation when large "adults" were also included.
So what have we learned so far?
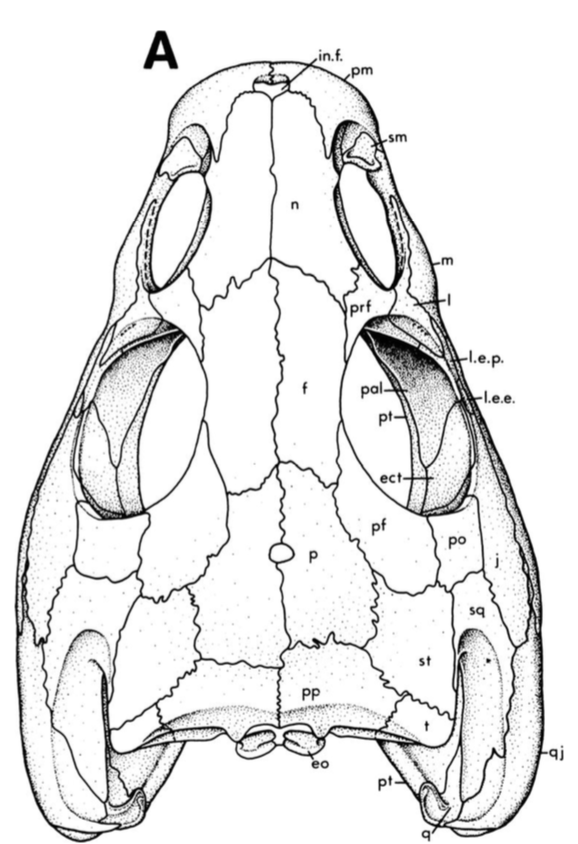
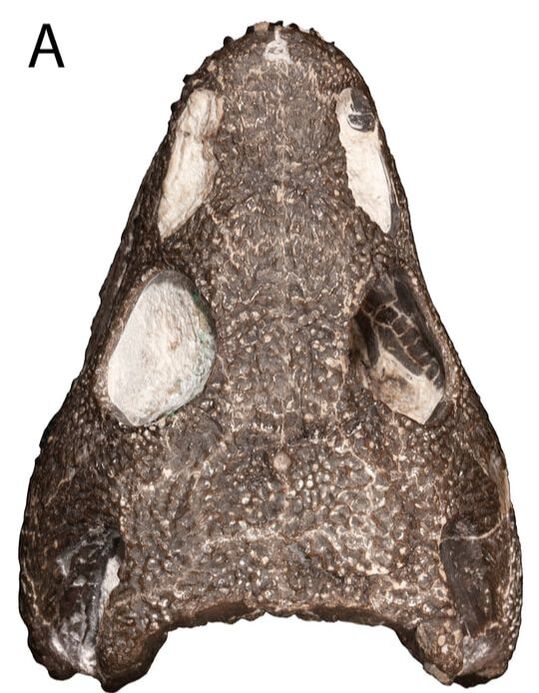
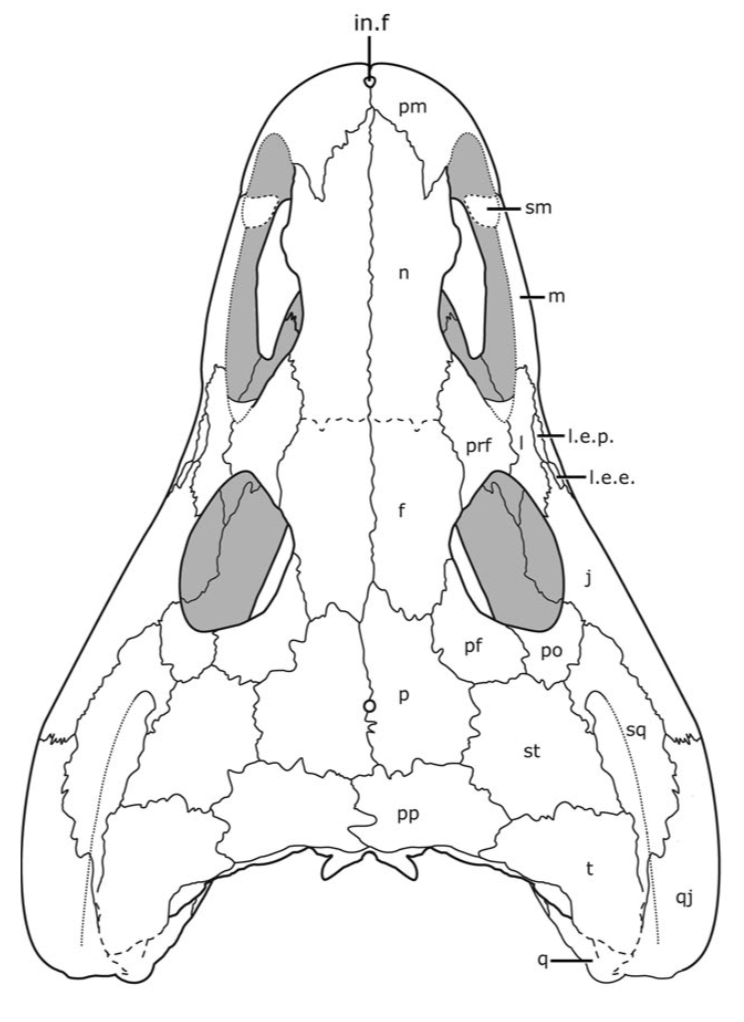
This paper is my first without any actual picture of a fossil, and only one of my figures has any representation of a fossil in it. Let's get some visuals back in here to help drive home the point. Below we have three skulls. On the LEFT is a standard Phonerpeton skull (again, this taxon is only known from skulls <7.5 cm; Dilkes, 1990). In the MIDDLE, we have a small Acheloma skull in that same size range. On the RIGHT is a large Acheloma skull (>15 cm; Polley & Reisz, 2011). Just look how similar the small Acheloma looks to the Phonerpeton in aspects like proportions (accounts for a number of phylogenetic characters), shape, profile, etc. compared to its adult form. This is the major problem that you run into with ontogenetic disparity. An analysis would code only the large Acheloma (the 'adult' of its kind) and the largest Phonerpeton (the most 'adult' of its kind), which is half its size. Now that I'm thinking about it, I think I should have put a figure like this in my previous paper...
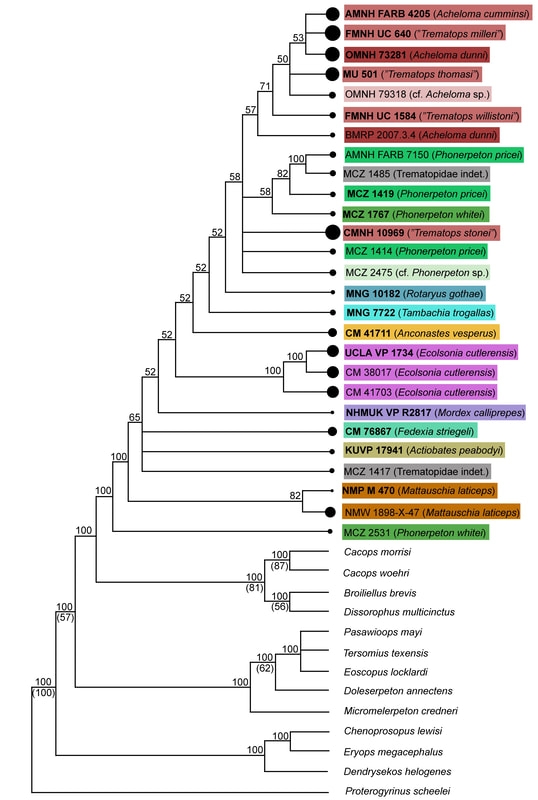
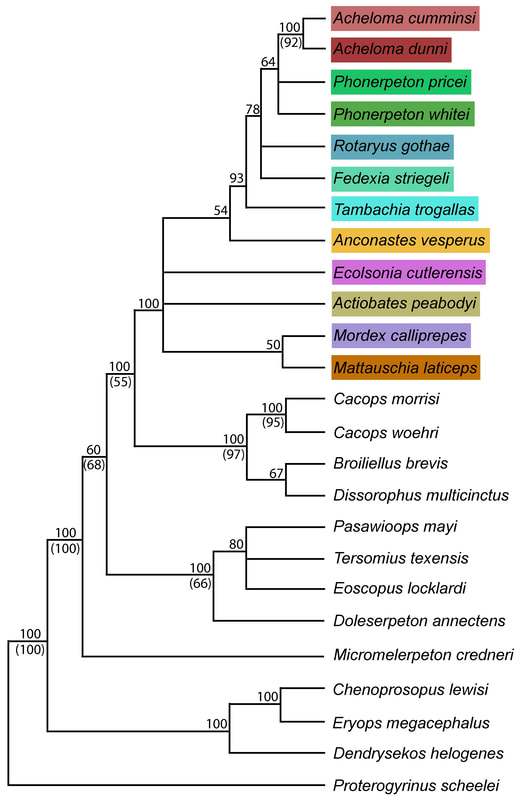
So mixed feelings at this point. On one hand, it's good that the matrix can detect ontogenetic disparity, and that it bears out that smaller specimens appear as more "primitive" OTUs. On the other hand, the resolution is horrendous, and virtually nothing can be said about the evolutionary relationships of trematopids. This was true for all of my specimen-level OTU permutations (four in total). Now as I mentioned before, people typically use species-level OTUs. So I thought okay, let's try that out. No. dice. Same deal as above, strict consensus on LEFT and majority-rule consensus on RIGHT. Still a giant comb over there on the left, and even on the right, there's a polytomy with a bunch of the taxa. You'll notice that basically the only definitive relationship is the sister relationship between the two species of Acheloma (in red) - I'll come back to that in a bit.
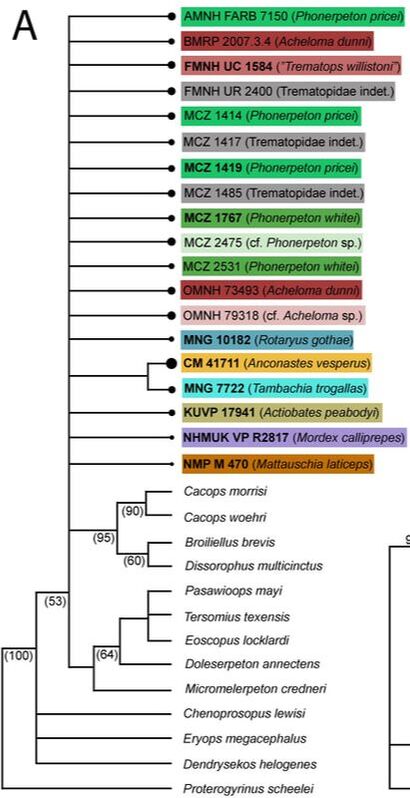
At this point, you think I designed a horrible study and that I love publishing polytomies; this isn't my first time after all. But hold on! One major caveat is that I have 12 trematopid taxa sampled here - all 12 of the accepted ones. No previous study has ever sampled more than 7 (although to those authors' credit, some were not described). So what this suggests is that adding new taxa, scored based on specimens of perhaps wildly differing size (they do differ wildly in size, I'm not sure why I said 'perhaps'), is discombobulating the phylogeny. To test this, I basically mirrored the previous two studies to do trematopid phylogenetics (Berman et al., 2011; Polley & Reisz, 2011) using their taxon sample (different samples of 7 taxa each) and analysis parameters. Here's what I got. These are all strict consensus trees.
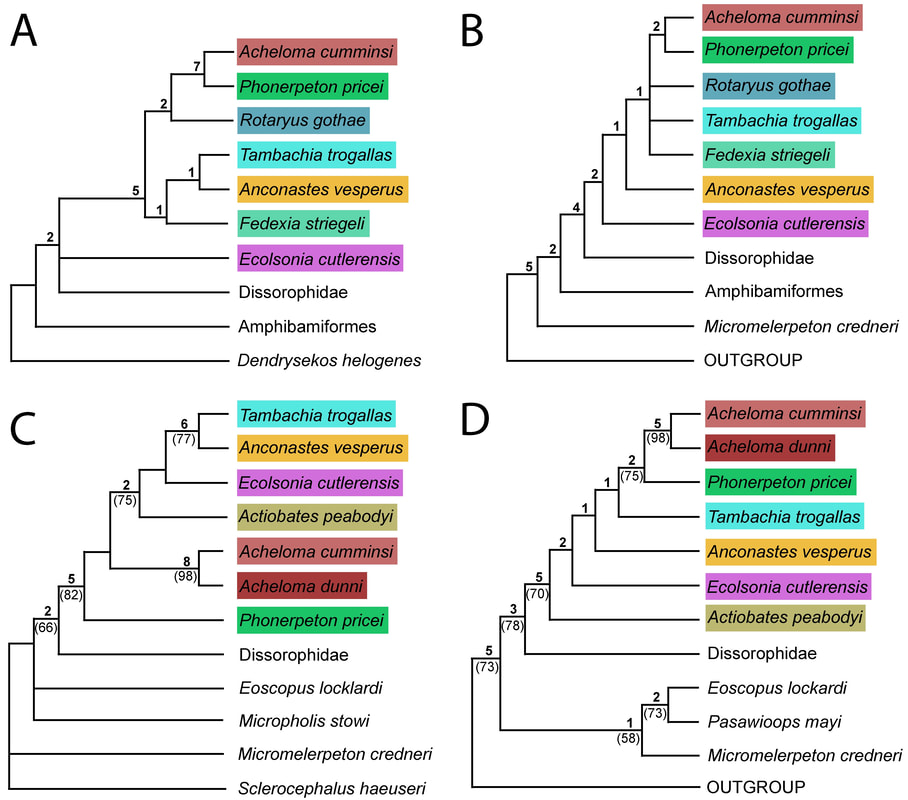 As you will notice, I have now achieved almost full resolution in my analyses, particularly in part D! This again suggests that the matrix is not the problem, but that the taxon sample of my study (increased by over 40% if you wanna get mathematical), or more precisely, the ontogenetic disparity of my new taxon additions, is causing the lack of resolution when I sampled all 12 taxa in some form. What does it all mean?
Other highlights
Refs
Michal Loba
2/24/2020 04:02:17 am
Great article - in many ways. I reffer to this one on the blog, I mean.
Bryan Gee
3/3/2020 11:40:06 pm
Hi Michal, thanks for your kind remarks! The main distinction between similarly sized Acheloma and Phonerpeton is a tooth-bearing ridge on the vomer in the former; it occurs across the size range of Acheloma and without any major changes in morphology, so it seems pretty reliable. As we conceive them now, there is a stratigraphic separation of the genera (Phonerpeton being older), but I try not to lean too heavily on this to avoid circular logic. Comments are closed.
|
About the blogA blog on all things temnospondyl written by someone who spends too much time thinking about them. Covers all aspects of temnospondyl paleobiology and ongoing research (not just mine). Categories
All
Archives
January 2024
|
 RSS Feed
